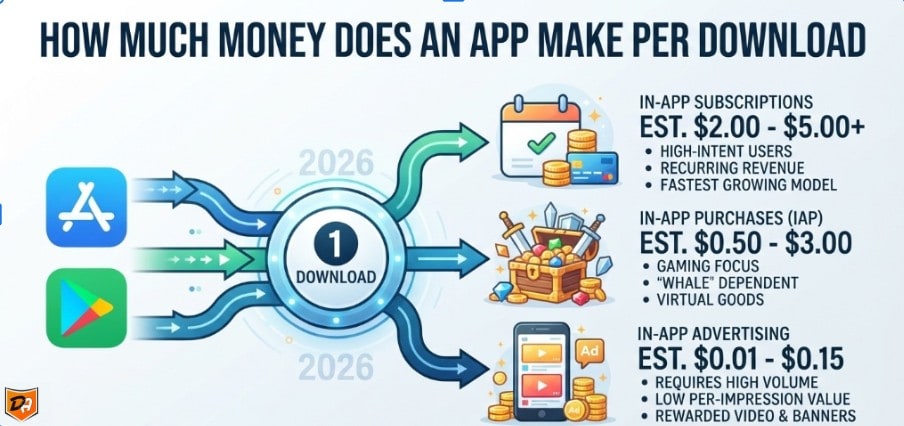
Globally across all categories, an app makes an average of $1.40 per download in 2026, according to recent Statista Market Forecast data. However, this baseline number is highly deceptive. Apps do not actually make money from the download itself; instead, they generate revenue through ongoing user activity via ads, in-app purchases (IAP), and subscriptions.
Because of this, the actual earnings per download range from less than $0.02 for simple ad-supported utilities to over $5.00 for high-intent subscription platforms. Furthermore, the app economy is intensely top-heavy: Adapty's 2026 data reveals that the top 10% of apps capture a massive 94.5% of all subscription revenue, while 57.7% of newly launched apps never cross $1,000 in total earnings.
Per-Download Value Matrix
| Monetization Model | Estimated Value Per Download | Primary Revenue Driver |
|---|---|---|
| Paid Apps | $0.99 – $4.99 | Upfront purchase fee |
| In-App Subscriptions | $2.00 – $5.00+ | High-intent recurring user fees |
| In-App Purchases (IAP) | $0.50 – $3.00 | Microtransactions & premium unlocks |
| In-App Advertising | $0.01 – $0.15 | High volume of recurring ad impressions |
Revenue Drivers by Model
- The Strategy: Free to download, but locks core value behind a paywall.
- The Numbers: The average iOS subscription cost has risen to $7.93 per month. Even with a modest 2% to 5% user conversion rate, a modest batch of downloads can yield high per-download revenue averages.
- The Bottleneck: 90% of user trial starts happen on the exact day of installation. If your onboarding paywall fails to convert a user immediately, the lifetime value of that download drops close to zero.
- The Strategy: Banner ads, interstitial ads, or rewarded videos.
- The Numbers: Payouts are calculated via eCPM (effective cost per thousand impressions). An app might require 1,000 ad views just to earn $2.00 to $10.00.
- The Bottleneck: If a user downloads an app, opens it once, and deletes it, the developer makes less than a fraction of a cent. High user retention is mandatory to build up ad earnings.
- The Strategy: Virtual currencies, expansion packs, or cosmetic items.
- The Numbers: Roughly 5% of global users regularly make in-app purchases.
- The Bottleneck: This model depends on "whales"—a tiny fraction of power-users who spend hundreds of dollars inside the app, effectively subsidizing the millions of users who download and play for free.
Critical Scale Benchmarks
- Small Tiers (1,000 downloads): Typically yield a minor $10 to $50 total monthly return. At this stage, organic traction is negligible, and most apps fail to find product-market fit.
- Growing Tiers (10,000 downloads): Can generate $500 to $2,000 per month. This is common for localized niche utilities or highly targeted B2B community tools.
- Medium Tiers (100,000 downloads): Scale up to $5,000 to $20,000 monthly. Strong retention strategies must be active here to combat natural user churn.
- Large Tiers (1,000,000+ downloads): Open up $100,000+ monthly revenue limits. Viral mechanics or heavy ad spending are usually required to maintain this velocity.
Platform Fees & Geographic Cuts
- The OS Platform Premium: iOS users typically spend significantly more than Android users. Apple's App Store claimed roughly 70% of total global app consumer spending ($117 billion vs. Google Play's $49 billion) despite logging a fraction of total global downloads.
- Store Commissions: Both Apple and Google enforce a standard 30% commission cut on digital goods and subscriptions. However, both platforms offer a small business tier dropping that fee to 15% for developers earning under $1 million annually.
- Geographic Demographics: Advertisers pay premium ad rates for traffic originating from Tier 1 regions like the United States, which commands the largest share of global app revenue ($317 billion). Downloads from developing markets pay far lower ad rates.
Benchmarking Mobile Revenue: Free vs. Paid App Performance in 2026
Free apps heavily outperform paid apps, generating over 98% of total global app store revenue in 2026, while upfront paid downloads have shrunk to less than 2% of the market. According to monetization data from sources like Business of Apps and Adapty, the traditional "paid-upfront" model has been almost entirely replaced by "freemium" dynamics—offering free entry barriers paired with continuous, backend monetizations like recurring subscriptions and dynamic in-app purchases (IAP)
Core Performance Comparison Matrix
| Metric | Free Apps (Freemium / Ad-Supported) | Paid Apps (Pay-to-Download) |
|---|---|---|
| Market Share | ~94% to 95% of active storefront catalogs | ~5% to 6% of active storefront catalogs |
| Revenue Contribution | 98.2% of global app store revenue | 1.8% of global app store revenue |
| Average LTV per User | Highly variable ($0.50 to $15.00+) | Tied almost strictly to the download price |
| User Acquisition Cost (CAC) | Lower; users freely test the interface | Very high; requires premium marketing convincing |
| User Retention (Day 30) | Low (~3% to 7% industry average) | Higher (~12% to 20% due to paid buy-in) |
Understanding the Freemium Dominance
Where Paid Apps Still Function
- Professional Creative Tools: High-end software for niche markets (e.g., specialized video editing, digital audio workstations, local field engineering utilities) where users expect clean, utility-focused, enterprise-grade software without paywalls or ads.
- Core Privacy Apps: High-security VPN services, encrypted password lockers, or tracker blockers that explicitly market the lack of ad monetization and data monetization as their defining security feature.
- Premium Indie Games: Ported desktop experiences or prestige indie titles that target console-like audiences who explicitly prefer an up-front price over repetitive microtransactions or pay-to-win barriers.
Deconstructing the Top App Monetization Models: Beyond the Initial Download
Hybrid Strategies Dominate
The Big Three Mechanics
                  ┌──────────────────────────────┐
                  │   Hybrid App Architecture    │
                  └──────────────┬───────────────┘
                                 │
         ┌───────────────────────┼───────────────────────┐
         ▼                       ▼                       ▼
┌─────────────────┐     ┌─────────────────┐     ┌─────────────────┐
│  Subscriptions  │     │In-App Purchases │     │  In-App Ads     │
│  (Predictable)  │     │ (High-Ceiling)  │     │ (Scale-Driven)  │
└─────────────────┘ └─────────────────┘ └─────────────────┘- The Paywall Strategy: Dynamic paywalls serve different pricing based on user behavior, location, or app usage patterns.
- Key Metric: Monthly Recurring Revenue (MRR) and Churn Rate.
- The Strategy: Scarcity-driven marketplaces and seasonal item drops.
- Key Metric: Average Revenue Per Paying User (ARPPU).
- The Strategy: Rewarded video ad placements, where users willingly view a 30-second ad in exchange for a premium feature or in-game item.
- Key Metric: Effective Cost Per Mille (eCPM)—the earnings generated per 1,000 ad impressions.
Advanced Monetization Models
- How It Works: The app is completely free to browse and use, but a minor processing fee (typically 1.5% to 5%) is automatically skimmed off every transaction passing through the system.
- The Advantage: Highly scalable; directly aligns app revenue with user business success.
- How It Works: Anonymized, aggregated user behavior trends, demographic shifts, or local weather data are packaged and sold to research institutions or corporate entities.
- The Advantage: Completely silent monetization that preserves a clean, ad-free experience for the end-user. Strict privacy standards (GDPR/CCPA) must be engineered from day one.
- How It Works: The application architecture is built once and then resold to third-party enterprises who brand it as their own internal system.
- The Advantage: Upfront enterprise licensing fees are highly lucrative, ranging from $10,000 to $100,000+ per client contract.
Optimization Blueprint
| Phase | Core Objective | Primary Actions |
|---|---|---|
| 1. Onboarding | Convert high-intent users immediately | Trigger a seasonal paywall discount within the first 3 sessions. |
| 2. Engagement | Keep non-paying users active | Introduce rewarded video options to prevent users from hitting a hard wall. |
| 3. Retention | Maximize long-term lifetime value | Use localized push notifications and tiered bundle upgrades to prevent churn. |
Cost Per Download vs. Life Time Value (LTV): The Math Behind Sustainable App Success
The Unit Economics Equation
    ┌────────────────────────────────────────────────────────┐
    │              THE SUSTAINABILITY EQUATION               │
    └────────────────────────────────────────────────────────┘

         LTV : CPD ≧ 3 : 1      ──►  Highly Profitable & Scalable
         LTV : CPD = 1 : 1      ──►  Stagnant (Breaking Even)
         LTV : CPD < 1 : 1      ──►  Unsustainable (Losing Money)
- 1:1 Ratio (Break-Even): You are spending all your revenue just to acquire users. This leaves zero capital for development, operational overhead, server costs, or profit.
- 3:1 Ratio (The Sweet Spot): A $1.50 download cost yields $4.50 in lifetime value. This leaves $1.50 for product reinvestment and $1.50 in pure profit margin.
Deconstructing the Variables
- Formula:
CPD = Total Ad Spend / Total Installs Generated - 2026 Reality: CPD is highly volatile. A hyper-casual mobile game might enjoy a cheap $0.40 CPD via social media ads, while a highly competitive fintech or business app can easily face a $5.00 to $15.00+ CPD to acquire a single user.
- The Math:
LTV = ARPU (Average Revenue Per User) × User Lifespan - Alternative Breakdown:
LTV = (Monetization Rate × Average Purchase Value) / Churn Rate
Real-World Scenarios
- The Spend: Paid social ads cost $0.50 per download.
- The Behavior: The app relies entirely on banner ads. It has poor retention, and the average user deletes the app after just 3 days.
- The Math: Over those 3 days, the user views 20 ads, generating $0.15 in total LTV.
- The Outcome: Failure (- $0.35 per user). The developer cannot afford to run paid marketing campaigns and must rely strictly on unreliable organic virality to survive.
- The Spend: Highly targeted search ads cost a premium $3.50 per download.
- The Behavior: A smooth onboarding sequence converts 5% of downloads into a $10.00/month subscription. The average subscriber stays for 6 months.
- The Math: A subscriber spends $60.00 total. Distributed across your entire download base (including the 95% who don't pay), the average LTV per download is $3.00. Additionally, ad networks built into the free tier pull in an extra $1.20 in ad revenue from the non-payers, pushing total LTV to $4.20.
- The Outcome: Success (+ $0.70 per user). The unit economics are sound. The developer can confidently pump capital into paid user acquisition channels to scale the business.
Playbook to Shift the Equation
                       To Optimize Your Math:
                                 │
         ┌───────────────────────┴───────────────────────┐
         ▼                                               ▼
  LOWER YOUR CPD:                                 RAISE YOUR LTV:
  • Run App Store Optimization (ASO)              • Build a day-one paywall
  • Use localized, native video ads              • Introduce multi-month bundles
  • Target custom lookalike audiences             • Set up push loops for churned users